Thursday, February 26, 2009

Grid Control: Create user-defined metrics at OS level


Using a scripting language of your choice, create a script that contains logic to check for the condition being monitored.
For example, scripts that check for disk space or memory usage.
All scripts to be run with User-Defined Metrics should be placed in a directory to which the Management Agent has full access privileges.
Scripts themselves must have the requisite permissions set so that they can be executed by the Management Agent.
The script runtime environment must also be configured:
If your script requires an interpreter, such as a Perl interpreter, this must be installed on that host as well.

Let's say that we want to create a metric to alert us if something is wrong with a critical OS process running to our server.
This could be the e-BS Internal Manager.
First of all, we need to create the script "/appl/oragrid/checkInternal.sh":

#!/bin/sh
PS=`ps -ef|grep FNDCPMBR|grep -v grep|wc -l`

echo em_result=$PS
if test $PS -eq 1
then
echo em_message='Internal Manager is OK.'
else
if test $PS -gt 1
then
echo em_message='Stucked Internal Manager process found.'
else
echo em_message='Internal Manager is down.'
fi
fi

Enterprise Manager needs two parameters to be set, in order to be able to process the script's output, em_result and em_message.
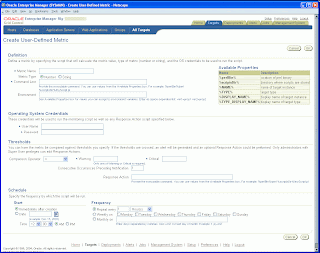
em_result is the value that will be compared against the warning and critical threshold you will set in the metric's creation page (see image) and raise the appropriate alert.
The default message for this alert will be: "The value is [em_result]".
For our example, "=1" means we have one Internal Manager process, which is the expected behavior.
">1" means that more than one processes are running and "<1" that there is no process running.
Both these conditions are not acceptable and an alert should be risen about them.
If we want to receive a more clear message than the default for our alert, we set the em_message parameter.
So, if "em_result=1" then "Internal Manager is OK", if "em_result>1" then "Stucked Internal Manager process found" and if "em_result<1" then "Internal Manager is down".

The next step is to create the alert from the Enterprise Manager.
Login and go to the Targets tab.
In the Hosts tab, choose the host where you created your script and to the Related Links section, click the User-defined Metrics link.
Press the Create button and you will be transferred to the page shown in the image attached.
In the Command Line field enter the full command path and the full path name of your script, for our case: "/usr/bin/sh /appl/oragrid/checkInternal.sh".
Choose the appropriate Comparison Operator (for our example this is: "!=") and the Warning and Critical Thresholds.
For our example we set "1" in the Critical field.
Scheduling is obvious.
You define how frequently your metric will be monitored by the Enterprise Manager.
Now, whenever something is wrong with our Internal Manager process on our server, an alert will rise and will be displayed with the message of our choice on on the main host page under the Alerts section.
To be notified via e-mail for these types of alerts, just add the User Defined Numeric Metric in the notification rule you already have for your host or create a new one.
Be sure to be subscribed to this notification rule.

library cache lock

Most of the info discussed here are from Metalink Note 444560.1.
The library cache lock event is also associated with library cache concurrency.
A session must acquire a library cache lock on an object handle to prevent other sessions from accessing it at the same time,
or to maintain a dependency for a long time, or to locate an object in the library cache.
Both locks and pins are provided to access objects in the library cache.

Locks manage concurrency between processes, whereas pins manage cache coherence. In order to access an object, a process must first lock the object handle, and then pin the object heap itself.
Requests for both locks and pins will wait until granted. This is a possible source of contention, because there is no NOWAIT request mode.

By acquiring a lock on the object handle, a process can prevent other processes from accessing the object, or even finding out what type it is.
It can even maintain a dependency on an object without preventing other processes from accessing the object.
Acquiring a lock is also the only way to locate an object in cache—a process locates and locks an object in a single operation.

If the process wants to actually examine or modify the object, then it must acquire a pin on the object itself (after acquiring a lock on the handle).
Pinning the object causes information about the object and its heaps to be loaded into memory if they were not already there.
This information is guaranteed to remain in memory at least until the pin is released. Locks and pins are externalized in X$KGLLK and X$KGLPN, respectively.

Oracle needs Library Cache Lock and Library Cache Pin for the compilation/Parsing of Package/Procedure/Function/View.
This is to ensure that no one is using the object during compilation/parsing as we are making some changes to the definition of the object
and need to drop and recreate the object with the new definition.

When a SQL statement is hard parsed by a session, the session has to acquire a library cache lock so that the other sessions can be prevented from accessing or modifying the same object.
If this event accumulates a lot of time, then it may indicate that the shared pool is too small or is being flushed regularly.
Otherwise, it indicates that database object definitions are being changed regularly.
Apart from hard parsing, if the session wants to change the definition of the object specified in the SQL or do any modifications,
then it has to acquire a library cache lock along with the library cache pin.
It is pinning because it needs the dictionary information to be loaded in the memory to access the same to modify/change the object.

You may use X$KGLLK to find the session which holds the lock:
SELECT SID,
       USERNAME,
       TERMINAL,
       PROGRAM
  FROM V$SESSION
 WHERE SADDR IN
          (SELECT KGLLKSES
             FROM X$KGLLK LOCK_A
            WHERE KGLLKREQ = 0
                  AND EXISTS
                         (SELECT LOCK_B.KGLLKHDL
                            FROM X$KGLLK LOCK_B
                           WHERE     KGLLKSES = 'C0000006D1AFE550' --saddr of blocked session from v$session
                                 AND LOCK_A.KGLLKHDL = LOCK_B.KGLLKHDL
                                 AND KGLLKREQ > 0));

library cache pin

The library cache pin wait event is associated with library cache concurrency.
It occurs when the session tries to pin an object in the library cache to modify or examine it.
The session must acquire a pin to make sure that the object is not updated by other sessions at the same time.
Oracle posts this event when sessions are compiling or parsing PL/SQL procedures and views.

What actions to take to reduce these waits depend heavily on what blocking scenario is occurring.
A common problem scenario is the use of DYNAMIC SQL from within a PL/SQL procedure where the PL/SQL code is recompiled and the DYNAMIC SQL calls something that depends on the calling procedure.
If there is general widespread waiting, the shared pool may need tuning.
If there is a blocking scenario, the following SQL can be used to show the sessions that are holding and/or requesting pins on the object that are given in P1 in the wait:
SELECT S.SID, KGLPNMOD "Mode", KGLPNREQ "Req"
  FROM X$KGLPN P, V$SESSION S
 WHERE P.KGLPNUSE = S.SADDR AND KGLPNHDL = '&P1RAW';

Kill the session with Req=0, Mode=3 or 2.

You can also find out the object's owner and name:
SELECT KGLNAOWN AS OWNER, KGLNAOBJ AS OBJECT
  FROM SYS.X$KGLOB
 WHERE KGLHDADR = '&P1RAW';

You can get P1RAW from v$session_wait view.

Tuesday, February 24, 2009

Indexes not being used due to different data types and data casting problems

We have a table XDP_ORDER_HEADERS, which has a column named EXTERNAL_ORDER_NUMBER of VARCHAR2 type, but, in essence, we store numeric values in it.
SELECT EXTERNAL_ORDER_NUMBER FROM XDP_ORDER_HEADERS;
  
EXTERNAL_ORDER_NUMBER
1000291
1000292
1000293
1000294
1000295
1000296
1000297
1000298
1000299
100030
1000300

We create an index named XDP_ORDER_HEADERS_IDX on that column.
Since we know that in this column we store numbers, executing the query:
SELECT *
  FROM XDP_ORDER_HEADERS
 WHERE EXTERNAL_ORDER_NUMBER = 1000296;

should use our index and run faster, right?
Wrong!
The execution plan shows us that a Full Table Scan is used instead by the CBO:

PlanIO CostCPU CostBytesCost
SELECT STATEMENT CHOOSE7.505835,979,2871908.35
1 TABLE ACCESS FULL DP.XDP_ORDER_HEADERS7.505835,979,2871908.35

Since this column is of VARCHAR2 type, we should compare it with VARCHAR2 values, if we want the right index to be used.
So, the query that will take use of our index is the following:
SELECT *
  FROM XDP_ORDER_HEADERS
 WHERE EXTERNAL_ORDER_NUMBER = '1000296';
 
PlanIO CostCPU CostBytesCost
SELECT STATEMENT CHOOSE423.041905
2 TABLE ACCESS BY INDEX ROWID XDP.XDP_ORDER_HEADERS423.041905
1 INDEX RANGE SCAN NON-UNIQUE XDP.XDP_ORDER_HEADERS_IDX314.4824

Grid Control: Create user-defined metrics at database level


User-Defined Metrics allow you to extend the reach of Enterprise Manager’s monitoring to conditions specific to particular environments via custom scripts or SQL queries and function calls. Once defined, User-Defined Metrics will be monitored, aggregated in the repository and trigger alerts, like regular metrics.

Login to Enterprise Manager and go to the Databases tab. Enter the database you choose and at the Related Link section click the User-defined Metrics link.
Press Create button and you will be transferred to the page shown at the image posted, where you can create your custom metric.

I will not explain every detail you see in this page, since a lot of them are obvious.
You should understand the meaning of thresholds. Your query should return a single value or a two-column set of values. In the first case, you set the Comparison Operator and the Warning and Critical Values according to what you want. In the second case, in the Warning Thresholds by Key and Critical Thresholds by Key fields you define for individual keys specific values that trigger an alert. An example:

SELECT ename FROM emp
Threshold settings for this example are shown.
Use the format key:value . Keys are case-sensitive.
■ Warning:500
■ Critical:300
■ Comparison Operator: < ■ Warning threshold by key: SMITH:250;JONES:400;CLARK:900 The warning threshold is set to 250 for SMITH, 400 for JONES, and 900 for CLARK. ■ Critical threshold by key: SMITH:100;JONES:200;CLARK:500 The critical threshold is set to 100 for SMITH, 200 for JONES, and 500 for CLARK. All other keys will use the threshold values specified in the Warning and Critical fields. When these conditions are met, a warning or critical alert will be risen on the main database page under the Alerts section.

Now, an example for a String metric type.
Supposedly, you want to raise an alert when a job in your database becomes broken (stops running). An appropriate query could be:

select broken from dba_jobs where what = 'KEEP_SIZE_AUD_LOG';

This will return either 'Y' or 'N' (a string value). So, I choose String Metric Type and Single Value SQL Query Output. For Comparison Operator we choose MATCH and and we enter Y in the field Critical. Warning alert has no meaning in our case, so this field will be left blank.
Now, when this particular job stops running a Critical Alert will be risen
on the main database page under the Alerts section.

If you do not want to get as an Alert name something vogue, such as "[Metric Name]=Y", you may enter something else in the Alert Message field, like "Job KEEP_SIZE_AUD_LOG is broken." For the "
SELECT ename FROM emp" example you could use "Underpaid Employee: %Key% has salary of %value%", so e.g. you will get a warning alert if Smith's [key] salary drops below 250 [value].

Scheduling is obvious. You define how frequently your metric will be monitored by the Enterprise Manager.

To be notified via e-mail for these types of alerts, just add the User Defined Numeric Metric and/or User-Defined String Metric in the notification rule you already have for your database or create a new one. Be sure to be subscribed to this notification rule.

latch free

The latch free wait occurs when the process waits to acquire a latch that is currently held by other process.
Like enqueue, Oracle uses latches to protect data structures.
One process at a time can either modify or inspect the data structure after acquiring the latch.
Other processes needing access to the data structure must wait till they acquire the latch. Unlike enqueue, processes requesting latch do not have to wait in a queue.
If the request to acquire a latch fails, the process simply waits for a short time and requests the latch again.
The short wait time is called “spin”. If the latch is not acquired after one or more spin iterations, the process sleeps for a short time and tries to acquire the latch again,
sleeping for successively longer periods until the latch is obtained.

You can determine which latch is waited, using this query:
SELECT NAME,
       ADDR,
       'Child ' || CHILD#,
       GETS,
       MISSES,
       SLEEPS
  FROM GV$LATCH_CHILDREN
 WHERE ADDR = '&P1RAW'
UNION
SELECT NAME,
       ADDR,
       NULL,
       GETS,
       MISSES,
       SLEEPS
  FROM GV$LATCH
 WHERE ADDR = '&P1RAW';

The types are described here.
Use the script posted in "Identify waiting sessions".

1. Using the SQL hash value from the CURRENT_EVENT cursor, you can capture the SQL textfrom the GV$SQLTEXT view as shown next and store it in the appropriate history table.
If you are also interested in the SQL statistics, you can get the information from the V$SQLAREA using the same SQL hash value from the cursor:
SELECT INST_ID,
         HASH_VALUE,
         ADDRESS,
         PIECE,
         SQL_TEXT
    FROM GV$SQLTEXT
   WHERE HASH_VALUE = 4190307765                              --sql_hash_value
                                AND INST_ID = 1                 --RAC Instance
ORDER BY INST_ID, PIECE;

2. Find the hot block:
SELECT TS#,
         FILE#,
         DBARFIL,
         DBABLK,
         OBJ,
         CLASS,
         STATE,
         TCH
    FROM X$BH
   WHERE HLADDR = 'C0000006FE846AD8' --P1RAW or ADDR from gv$latch_children/gv$latch
ORDER BY TCH DESC;

Blocks with a TCH (touch count) value that go into double figures or bigger are possible targets for hot blocks.
SELECT DISTINCT A.OBJECT_NAME, A.SUBOBJECT_NAME
  FROM DBA_OBJECTS A, SYS.X$BH B
 WHERE     (A.OBJECT_ID = B.OBJ OR A.DATA_OBJECT_ID = B.OBJ)
       AND B.FILE# = 604                        --DBARFIL
       AND B.DBABLK = 2003;                     --DBABLK

Latches

This is a copy of Metalink's Reference Note 22908.1, for those that do not have access to it.

1. What is a latch?

Latches are low level serialization mechanisms used to protect shared data structures in the SGA. The implementation of latches is operating system dependent, particularly in regard to whether a process will wait for a latch and for how long.

A latch is a type of a lock that can be very quickly acquired and freed. Latches are typically used to prevent more than one process from executing the same piece of code at a given time. Associated with each latch is a cleanup procedure that will be called if a process dies while holding the latch. Latches have an associated level that is used to prevent deadlocks. Once a process acquires a latch at a certain level it cannot subsequently acquire a latch at a level that is equal to or less than that level (unless it acquires it nowait).

2.Latches vs. Enqueues

Enqueues are another type of locking mechanism used in Oracle.
An enqueue is a more sophisticated mechanism which permits several concurrent processes to have varying degree of sharing of "known" resources. Any object which can be concurrently used, can be protected with enqueues. A good example is of locks on tables. We allow varying levels of sharing on tables e.g. two processes can lock a table in share mode or in share update mode etc. One difference is that the enqueue is obtained using an OS specific locking mechanism. An enqueue allows the user to store a value in the lock, i.e the mode in which we are requesting it. The OS lock manager keeps track of the resources locked. If a process cannot be granted the lock because it is incompatible with the mode requested and the lock is requested with wait, the OS puts the requesting process on a wait queue which is serviced in FIFO.

Another difference between latches and enqueues is that in latches there is no ordered queue of waiters like in enqueues. Latch waiters may either use timers to wakeup and retry or spin (only in multiprocessors). Since all waiters are concurrently retrying (depending on the scheduler), anyone might get the latch and conceivably the first one to try might be the last one to get.

3. When do we need to obtain a latch?

A process acquires a latch when working with a structure in the SGA (System Global Area). It continues to hold the latch for the period of time it works with the structure. The latch is dropped when the process is finished with the structure. Each latch protects a different set of data, identified by the name of the latch.

Oracle uses atomic instructions like "test and set" for operating on latches. Processes waiting to execute a part of code for which a latch has already been obtained by some other process will wait until the latch is released. Examples are redo allocation latches, copy latches, archive control latch etc. The basic idea is to block concurrent access to shared data structures. Since the instructions to set and free latches are atomic, the OS guarantees that only one process gets it. Since it is only one instruction, it is quite fast. Latches are held for short periods of time and provide a mechanism for cleanup in case a holder dies abnormally while holding it. This cleaning is done using the services of PMON.

4. Latches request modes?

Latches request can be made in two modes: "willing-to-wait" or "no wait". Normally, latches will be requested in "willing-to-wait" mode. A request in "willing-to-wait" mode
will loop, wait, and request again until the latch is obtained. In "no wait" mode the process request the latch. If one is not available, instead of waiting, another one is requested. Only when all fail does the server process have to wait.

Examples of "willing-to-wait" latches are: shared pool and library cache latches
A example of "no wait" latches is the redo copy latch.

5. What causes latch contention?
If a required latch is busy, the process requesting it spins, tries again and if still not available, spins again. The loop is repeated up to a maximum number of times determined by the initialization parameter _SPIN_COUNT. If after this entire loop, the latch is still not available, the process must yield the CPU and go to sleep. Initially is sleeps for one centisecond. This time is doubled in every subsequent sleep.

This causes a slowdown to occur and results in additional CPU usage, until a latch is available. The CPU usage is a consequence of the "spinning" of the process. "Spinning" means that the process continues to look for the availability of the latch after certain intervals of time, during which it sleeps.


6. How to identify contention for internal latches?

Relevant data dictionary views to query:

V$LATCH
V$LATCHHOLDER
V$LATCHNAME

Each row in the V$LATCH table contains statistics for a different type of latch. The columns of the table reflect activity for different types of latch requests. The distinction between these types of requests is whether the requesting process continues to request a latch if it is unavailable:

willing-to-wait If the latch requested with a willing-to-wait
request is not available, the requesting process
waits a short time and requests the latch again.
The process continues waiting and requesting until
the latch is available.

no wait If the latch requested with an immediate request is
not available, the requesting process does not
wait, but continues processing.

V$LATCHNAME key information:
---------------------------------------

GETS Number of successful willing-to-wait requests for
a latch.

MISSES Number of times an initial willing-to-wait request
was unsuccessful.

SLEEPS Number of times a process waited a requested a latch
after an initial wiling-to-wait request.

IMMEDIATE_GETS Number of successful immediate requests for each latch.

IMMEDIATE_MISSES Number of unsuccessful immediate requests for each latch.

Calculating latch hit ratio
----------------------------

To get the Hit ratio for latches apply the following formula:

"willing-to-wait" Hit Ratio=(GETS-MISSES)/GETS
"no wait" Hit Ratio=(IMMEDIATE_GETS-IMMEDIATE_MISSES)/IMMEDIATE_GETS

This number should be close to 1. If not, tune according to the latch name

7. Useful SQL scripts to get latch information

/*
** Display System-wide latch statistics.
*/
column name format A32 truncate heading "LATCH NAME"
column pid heading "HOLDER PID"
select c.name,a.addr,a.gets,a.misses,a.sleeps,
a.immediate_gets,a.immediate_misses,b.pid
from v$latch a, v$latchholder b, v$latchname c
where a.addr = b.laddr(+)
and a.latch# = c.latch#
order by a.latch#;

/*
** Given a latch address, find out the latch name.
*/
column name format a64 heading 'Name'
select a.name from v$latchname a, v$latch b
where b.addr = '&addr'
and b.latch#=a.latch#;

/*
** Display latch statistics by latch name.
*/
column name format a32 heading 'LATCH NAME'
column pid heading 'HOLDER PID'
select c.name,a.addr,a.gets,a.misses,a.sleeps,
a.immediate_gets,a.immediate_misses,b.pid
from v$latch a, v$latchholder b, v$latchname c
where a.addr = b.laddr(+) and a.latch# = c.latch#
and c.name like '&latch_name%' order by a.latch#;

8. List of all the latches

Oracle versions might differ in the latch# assigned to the existing latches.
The following query will help you to identify all latches and the number assigned.

column name format a40 heading 'LATCH NAME'
select latch#, name from v$latchname;

9. List of latches that are of most concern to a DBA

  • BUFFER CACHE LATCHES: There are two main latches which protect data blocks in the buffer cache. Contention for these two latches is usually seen when a database has high I/O rates. We can reduce contention for these latches and tune them by adjusting certain init.ora parameters.

Cache buffers chains latch:

This latch is acquired whenever a block in the buffer cache is accessed (pinned).

Reducing contention for the cache buffer chains latch will usually require reducing logical I/O rates by tuning and minimizing the I/O requirements of the SQL involved. High I/O rates could be a sign of a hot block (meaning a block highly accessed).

See Note 163424.1 How To Identify a Hot Block Within The Database to correctly identify this issue.

Cache buffers LRU chain latch:

The cache buffer lru chain latch is acquired in order to introduce a new block into the buffer cache and when writing a buffer back to disk, specifically when trying to scan the LRU (least recently used) chain containing all the dirty blocks in the buffer cache.

Its possible to reduce contention for the cache buffer lru chain latch by increasing the size of the buffer cache and thereby reducing the rate at which new blocks are introduced into the buffer cache. Two parameters dictate the size of the buffer cache, DB_BLOCK_SIZE and DB_BLOCK_BUFFERS. In actuality, only the DB_BLOCK_BUFFERS can be changed without recreating the database. Caution, when tuning the buffer pool, avoid the use of additional buffers that contribute little or nothing to the cache hit ratio. A common mistake is to continue increasing the value of DB_BLOCK_BUFFERS. Such increases have no effect if you are doing full table scans or other operations that do not use the buffer cache. Multiple buffer pools can help reduce contention on this latch.You can create additional cache buffer lru chain latches by adjusting the configuration parameter DB_BLOCK_LRU_LATCHES. You may be able to reduce the load on the cache buffer chain latches by increasing the configuration parameter _DB_BLOCK_HASH_BUCKETS
  • REDOLOG BUFFER LATCHES: There are two Redo buffer latches, the redo allocation latch and the redo copy latch. The redo allocation latch must be acquired in order to allocate space within the buffer. If the redo log entry to be made is greater than the configuration parameter LOG_SMALL_ENTRY_MAX_SIZE, the session which acquires the redo allocation latch may copy the entry into the redo buffer immediately while holding the allocation latch. If the log entry is greater than LOG_SMALL_ENTRY_MAX_SIZE, then the session will release the redo allocation latch and will acquire the redo copy latch in order to copy the entry. There is only one redo allocation latch, but there may be up to LOG_SIMULTANEOUS_COPIES allocation latches.

Redo allocation latch:

This latch controls the allocation of space for redo entries in the redo log buffer. There is one redo allocation latch per instance.

Contention for this latch in Oracle7 can be reduced by decreasing the value of LOG_SMALL_ENTRY_MAX_SIZE on multi-cpu systems to force the use of the
redo copy latch. In Oracle8i this parameter is obsolete, so you need to consider to increase the size of the LOG_BUFFER or reduce the load of the log buffer using NOLOGGING features when possible.

Redo copy latch:

This latch is used to write redo records into the redolog buffer. This latch is waited for on both single and multi-cpu systems.

On multi-cpu systems, contention can be reduced by increasing the value of LOG_SIMULTANEOUS_COPIES (Hidden in Oracle8i) and/or increasing LOG_ENTRY_PREBUILD_THRESHOLD (undocumented in Oracle7).
  • LIBRARY CACHE

Library cache latch:

The library cache latches protect the cached SQL statements and objects definitions held in the library cache within the shared pool. The library cache latch must be acquired in order to add a new statement to the library cache. During a parse, Oracle searches the library cache for a matching statement. If one is not found, then Oracle will parse the SQL statement, obtain the library cache latch and insert the new SQL.

The first resource to reduce contention on this latch is to ensure that the application is reusing as much as possible SQL statement representation. Use bind variables whenever possible in the application. Misses on this latch may also be a sign that the application is parsing SQL at a high rate and may be suffering from too much parse CPU overhead.If the application is already tuned the SHARED_POOL_SIZE can be increased. Be aware that if the application is not using the library cache appropriately, the contention might be worse with a larger structure to be handled.

The _KGL_LATCH_COUNT parameter controls the number of library cache latches. The default value should be adequate, but if contention for the library cache latch cant be resolved, it may be advisable to increase this value. The default value for _KGL_LATCH_COUNT is the next prime number after CPU_COUNT. This value cannot exceed 66 (See: ).

Library cache pin latch:
The library cache pin latch must be acquired when a statement in the library cache is reexecuted. Misses on this latch occur when there is very high rates SQL execution.
There is little that can be done to reduce the load on the library cache pin latch, although using private rather than public synonyms or direct object references such as OWNER.TABLE may help.
  • SHARED POOL RELATED LATCHES
Shared pool latch:

While the library cache latch protects operations withing the library cache, the shared pool latchis used to protect critical operations when allocating and freeing memory in the shared pool.
If an application makes use of literal (unshared) SQL then this can severely limit scalability and throughput. The cost of parsing a new SQL statement is expensive both in terms of CPU requirements and the number of times the library cache and shared pool latches may need to be acquired and released. Before Oracle9, there use to be just one such latch to the entire database to protects the allocation of memory in the library cache. In Oracle9 multiple childs were introduced to relieve contention on this resource.

Ways to reduce the shared pool latch are, avoid hard parses when possible, parse once, execute many. Eliminating literal SQL is also useful to avoid the shared pool latch. The size of the shared_pool and use of MTS (shared server option) also greatly influences the shared pool latch. Note 62143.1 explains how to identify and correct problems with the shared pool, and shared pool latch.

Row cache objects latch:

This latch comes into play when user processes are attempting to access the cached data dictionary values.

It is not common to have contention in this latch and the only way to reduce contention for this latch is by increasing the size of the shared pool (SHARED_POOL_SIZE).

10. Tuning _SPIN_COUNT (_LATCH_SPIN_COUNT in Oracle7)

SPIN_COUNT controls how many times the process will re-try to obtain the latch before backing off and going to sleep. This basically means the process is in a tight CPU loop continually trying to get the latch for SPIN_COUNT attempts. On a single CPU system if an Oracle process tries to acquire a latch but it is held by someone else the process will release the CPU and go to sleep for a short period before trying again. However, on a multi processor system (SMP) it is possible that the process holding the latch is running on one of the other CPUs and so will potentially release the latch in the next few instructions (latches are usually held for only very short periods of time).

Performance can be adjusted by changing the value of SPIN_COUNT. If a high value is used, the latch will be attained sooner than if you use a low value. However, you may use more CPU time spinning to get the latch if you use a high value for SPIN_COUNT. You can decrease this probability of session sleeps by increasing the value of the configuration parameters _LATCH_SPIN_COUNT or SPIN_COUNT. This parameter controls the number of attempts the session will make to obtain the latch before sleeping. Spinning on the latch consumes CPU, so if you increase this parameter, you may see an increase in your systems overall CPU utilization. If your computer is near 100% CPU and your application is throughput rather than response time driven, you could consider decreasing SPIN_COUNT in order to conserve CPU. Adjusting SPIN_COUNT is trial and error. In general, only increase SPIN_COUNT if there are enough free CPU resources available on the system, and decrease it only if there is no spare CPU capacity.

To summarize latch sleeps and spin count, if you encounter latch contention and have spare CPU capacity, consider increasing the value of SPIN_COUNT. If CPU resources are at full capacity, consider decreasing the value of SPIN_COUNT.

direct path write

The direct path write wait event is just an opposite operation to that of direct path read.
Oracle writes buffers from the session’s PGA to the datafiles.
A session can issue multiple write requests and continue processing.
The OS handles the I/O operation.
If the session needs to know if the I/O operation was completed, it will wait on direct path write event.

The direct path write operation is normally used when writing to temporary segments,
in direct data loads (inserts with APPEND hint, or CTAS), or in parallel DML operations.
As with the direct path write event, the number of waits and time waited for this event can be misleading when asynchronous I/O is in use.
This event should occur, and there is no reason for alarm, during batch processing.

Use the script posted in "Identify waiting sessions".

From that, you can:

1. Using the SQL hash value from the CURRENT_EVENT cursor, you can capture the SQL textfrom the GV$SQLTEXT view as shown next and store it in the appropriate history table.
If you are also interested in the SQL statistics, you can get the information from the V$SQLAREA using the same SQL hash value from the cursor:

SELECT INST_ID,
         HASH_VALUE,
         ADDRESS,
         PIECE,
         SQL_TEXT
    FROM GV$SQLTEXT
   WHERE HASH_VALUE = 4190307765                              --sql_hash_value
                                AND INST_ID = 1                 --RAC Instance
ORDER BY INST_ID, PIECE;


2. Find the segment being read:
SELECT DISTINCT A.OBJECT_NAME, A.SUBOBJECT_NAME
  FROM DBA_OBJECTS A, SYS.X$BH B
 WHERE     (A.OBJECT_ID = B.OBJ OR A.DATA_OBJECT_ID = B.OBJ)
       AND B.FILE# = 604                        --P1
       AND B.DBABLK = 2003;                     --P2

direct path read

The direct path read event occurs when Oracle is reading data blocks directly into the session’s PGA instead of the buffer cache in the SGA.
Direct reads may be performed in synchronous I/O or asynchronous I/O mode, depending on the hardware platform and the value of the initialization parameter, DISK_ASYNCH_IO.
Direct read I/O is normally used while accessing the temporary segments that reside on the disks.
These operations include sorts, parallel queries, and hash joins.

The number of waits and time waited for this event are somewhat misleading.
If the asynchronous I/O is not available, the session waits till the I/O completes.
But these are not counted as waits at the time the I/O request is issued. The session posts a direct path read wait event when accessing the data after the completion of the I/O request.
In this case, the wait time will be negligibly small.

If the asynchronous I/O is available and in use, then the session may issue multiple direct path read requests and continue to process the blocks that are already cached in the PGA.
The session will register direct path read wait event only when it cannot continue processing because the required block has not been read into the buffer.
Therefore, the number of read requests may not be the same as the number of waits. Due to these anomalies, it is unlikely that you will see this wait event reported in V$SYSTEM_EVENT and V$SESSION_EVENT views.
This event should occur, and there is no reason for alarm, during batch processing.

Use the script posted in "Identify waiting sessions".

From that, you can:

1. Using the SQL hash value from the CURRENT_EVENT cursor, you can capture the SQL textfrom the GV$SQLTEXT view as shown next and store it in the appropriate history table. If you are also interested in the SQL statistics, you can get the information from the V$SQLAREA using the same SQL hash value from the cursor:
SELECT INST_ID,
         HASH_VALUE,
         ADDRESS,
         PIECE,
         SQL_TEXT
    FROM GV$SQLTEXT
   WHERE HASH_VALUE = 4190307765                              --sql_hash_value
                                AND INST_ID = 1                 --RAC Instance
ORDER BY INST_ID, PIECE;

2. Find the segment being read:

SELECT DISTINCT A.OBJECT_NAME, A.SUBOBJECT_NAME
  FROM DBA_OBJECTS A, SYS.X$BH B
 WHERE     (A.OBJECT_ID = B.OBJ OR A.DATA_OBJECT_ID = B.OBJ)
       AND B.FILE# = 604                                                  --P1
       AND B.DBABLK = 2003;                                               --P2

Saturday, February 21, 2009

Data Dictionary Inconsistency, after cancelling (CTRL-C) a drop of a function based index

Summary
Pressing CTRL-C during drop of function based index may result to a number of objects to became invalid.

For example, if you press CTRL-C while you drop a function based index on table applsys.fnd_loopup_values you have a chance to end up with invalid objects in the database.
Especially for E-Business Suite this will result in the following error while trying to log into Self Service Applications:
Error:Invalid argument.
URL:http://mysvr02.mysrv.com:8000/OA_HTML/RF.jsp?function_id=1283&resp_id=50583&resp_appl_id=401&security_group_id=0&lang_code=US&formsLink=yes
Click a "Web Based Form" eg iExpenses , then Expenses Home:
Oracle error 20001: java.sql.SQLException: ORA-20001: Oracle error -20001:
ORA-20001: APP-FND-02500: Error occurred during product initialization for PER when executing 'begin HR_SIGNON.INITIALIZE_HR_SECURITY; end;'. SQLCODE = -20001
SQLERROR = ORA-20001: SQL_PLSQL_ERROR: N, ROUTINE, HR_SIGNON.INITIALIZE_HR_SECURITY, N, ERRNO, -6508, N, REASON, ORA-06508:
PL/SQL: could not find program unit being called has been detected in FND_GLOBAL.INITIALIZE. ORA-06512: at "APPS.APP_EXCEPTION", line 70 ORA-06512:
at "APPS.FND_GLOBAL", line 64 ORA-06512: at "APPS.FND_GLOBAL", line 1028 ORA-06512: at "APPS.FND_SESSION_MANAGEMENT", line 573 ORA-06512: at
"APPS.FND_SESSION_MANAGEMENT", line 876 ORA-06512: at "APPS.FND_AOLJ_UTIL", line 220 ORA-06512: at line 1 has been detected in FND_AOLJ_UTIL.is_Valid_ICX.
Unable to authenticate session.

Metalink offers a solution to follow:

1. Compile apps schema.
2. Recreate Grants and Synonyms.
But it won't solve the problem!

The problem is that canceling the drop index left inconsistencies to the dictionary. One possible workaround is:
A. Find the Orphaned IND$ and manually delete them from the dictionary.
B. Compile all objects in the database.

A. Find the Orphaned IND$ and manually delete them
To identify Dictionary Inconsistency you must run as sysdba the check.full procedure using the script hcheck8i.sql

Instructions:
1. Connect as SYS schema in sqlplus
2. Create package hOut as described in Note 101468.1
3. Create package hcheck in SYS schema (Refer the attachment under SCRIPT to Create package hcheck)
4. spool outputfile
5. execute hcheck.full
6. It will create a trace file at the udump destination

An example output of the trace file:
SQL> set serveroutput on
SQL> execute hcheck.full
HCheck Version 8i/1.30

Problem:  Duplicate DATAOBJ# (may be valid if using transported TS)
DATAOBJ#=0 OBJ#=662756 Name=JTF.DR$JTF_TASKS_TL_IM$K  Type#=2
DATAOBJ#=0 OBJ#=662791 Name=JTF.DR$JTF_TASKS_TL_IM$N  Type#=2
DATAOBJ#=0 OBJ#=798928 Name=JTF.DR$JTF_NOTES_TL_C1$K  Type#=2
DATAOBJ#=0 OBJ#=798933 Name=JTF.DR$JTF_NOTES_TL_C1$N  Type#=2

Problem: Orphaned IND$ (no SEG$) - See Note:65987.1 (Bug:624613/3655873)
ORPHAN IND$: OBJ=830178 DOBJ=830178 TS=0 RFILE/BLOCK=0 0 BO#=830174
SegType= ^- May be OK. Needs manual check
ORPHAN IND$: OBJ=830176 DOBJ=830176 TS=0 RFILE/BLOCK=0 0 BO#=830174
SegType= ^- May be OK. Needs manual check
ORPHAN IND$: OBJ=830193 DOBJ=830193 TS=0 RFILE/BLOCK=0 0 BO#=830191
SegType= ^- May be OK. Needs manual check
ORPHAN IND$: OBJ=830201 DOBJ=830201 TS=0 RFILE/BLOCK=0 0 BO#=830199
SegType= ^- May be OK. Needs manual check
ORPHAN IND$: OBJ=537290 DOBJ=537290 TS=0 RFILE/BLOCK=0 0 BO#=537288
SegType= ^- May be OK. Needs manual check
ORPHAN IND$: OBJ=342801 DOBJ=342801 TS=0 RFILE/BLOCK=0 0 BO#=342799
SegType= ^- May be OK. Needs manual check
ORPHAN IND$: OBJ=299283 DOBJ=299283 TS=0 RFILE/BLOCK=0 0 BO#=299281
SegType= ^- May be OK. Needs manual check
ORPHAN IND$: OBJ=537280 DOBJ=537280 TS=0 RFILE/BLOCK=0 0 BO#=537278
SegType= ^- May be OK. Needs manual check
SEG$ has no UET$ entry: TS#=3 RFILE#=4 BLK#=2383 TYPE#=9
SEG$ has no UET$ entry: TS#=5 RFILE#=46 BLK#=21520 TYPE#=9
SEG$ has no UET$ entry: TS#=6 RFILE#=45 BLK#=11189 TYPE#=9
SEG$ has no UET$ entry: TS#=7 RFILE#=22 BLK#=9677 TYPE#=9
NB: TYPE#=9 is special and may be OK

Problem:  Table with Dropped Func Index  - Bug:1805146 / Note:148740.1
Table=APPLSYS.FND_CONCURRENT_PROGRAMS
Table=APPLSYS.FND_DESCRIPTIVE_FLEXS
Table=APPLSYS.FND_DESCR_FLEX_COLUMN_USAGES
Table=APPLSYS.FND_DOCUMENT_CATEGORIES
Table=APPLSYS.FND_FLEX_VALIDATION_EVENTS
Table=APPLSYS.FND_FLEX_VALIDATION_QUALIFIERS
Table=APPLSYS.FND_FLEX_VALIDATION_RULES
Table=APPLSYS.FND_FLEX_VALIDATION_TABLES
Table=APPLSYS.FND_FLEX_VALUE_RULES
Table=APPLSYS.FND_FLEX_VALUE_SETS
Table=APPLSYS.FND_ID_FLEX_SEGMENTS
Table=APPLSYS.FND_LOOKUP_TYPES
Table=APPLSYS.WF_ACTIVITIES
Table=FA.FA_ADDITIONS_B
Table=FA.FA_CATEGORIES_B
Table=FA.FA_LOOKUPS_B
Table=FA.FA_LOOKUP_TYPES_B
Table=FA.FA_RX_REP_COLUMNS_B
Table=HR.PER_ASSIGN_PROPOSAL_ANSWERS
Table=HR.PER_PROPOSAL_CATEGORY_MEMBERS
Table=HR.PER_PROPOSAL_CATEGORY_TYPES
Table=HR.PER_PROPOSAL_OFFER_PARAGRAPHS
Table=HR.PER_PROPOSAL_QUESTIONS_ADV
Table=HR.PER_PROPOSAL_QUESTION_MEMBERS
Table=HR.PER_PROPOSAL_QUESTION_TYPES
Table=HR.PER_PROPOSAL_TEMPLATES
Table=INV.MTL_MATERIAL_TRANSACTIONS
Table=INV.MTL_MATERIAL_TRANSACTIONS_TEMP
Table=MSC.MSC_REGIONS
Table=MSC.MSC_ST_REGIONS
Table=OE.SO_AGREEMENTS_B
Table=OE.SO_PRICE_LISTS_B
Table=OE.SO_PRICING_RULES_B
Table=OE.SO_RESULTS_B
Table=WIP.WIP_COST_TXN_INTERFACE

Problem:  SOURCE$ for OBJ# not in OBJ$ - Bug:3532977 ?
SOURCE$ has 197 rows for 11 OBJ# values not in OBJ$

Problem:  Dependency$ p_timestamp mismatch for VALID objects
....
....
....

Manual delete the Orphaned IND$
As you can see there are entries in the sys.OBJ$ and sys.IND$ but there not exist in the sys.dba_objects.

Record does not exist!
SELECT *
  FROM SYS.DBA_OBJECTS
 WHERE OBJECT_ID IN
          (830178, 830176, 830193, 830201, 537290, 342801, 299283, 537280);

Record exists
SELECT *
  FROM SYS.OBJ$
 WHERE OBJ# IN
          (830178, 830176, 830193, 830201, 537290, 342801, 299283, 537280);

SELECT *
  FROM SYS.IND$
 WHERE OBJ# IN
          (830178, 830176, 830193, 830201, 537290, 342801, 299283, 537280);

Backup the rows before delete
INSERT INTO SYS.OBJ$_DEL
   SELECT *
     FROM SYS.OBJ$
    WHERE OBJ# IN
             (830178, 830176, 830193, 830201, 537290, 342801, 299283, 537280);

INSERT INTO SYS.IND$_DEL
   SELECT *
     FROM SYS.IND$
    WHERE OBJ# IN
             (830178, 830176, 830193, 830201, 537290, 342801, 299283, 537280);

Delete from dictionary
DELETE FROM SYS.OBJ$
      WHERE OBJ# IN (830176, 830193, 830201, 537290, 342801, 299283, 537280);

DELETE FROM SYS.IND$
      WHERE OBJ# IN (830176, 830193, 830201, 537290, 342801, 299283, 537280);

COMMIT;


B. Compile all objects in the database.
As you can see for further examination of the trace file after executing hcheck.full there are Dependency$ p_timestamp mismatch for VALID objects
and especially for object_id=17540 (which is HR_API package) and other HR packages!

The solution to the invalidation and timestamps mismatch is to run UTLIRP.SQL.
UTLIRP.SQL is a SQL script which first invalidates & then recompiles PL/SQL modules, procedures, functions, packages, types, triggers, views in a database.
For E-Business Suite Database it will take approximately 7hours to complete!

Other related issues
pls-00907: cannot load library unit APPS.HR_API (referenced by #####) HR_API is a valid object.

This problem started occurring after they dropped a redundant custom index on the HR_ALL_ORGANIZATIONS_UNIT.
When they dropped this it seemed to take a while and then they had a bunch of invalid objects.

Thursday, February 19, 2009

db file sequential read

The db file sequential read wait event occurs when the process waits for an I/O completion for a sequential read.
The name is a bit misleading, suggesting a multiblock operation, but this is a single block read operation.
The event gets posted when reading from an index, rollback or undo segments, table access by rowid, rebuilding control files, dumping datafile headers, or the datafile headers.

Waiting on datafile I/O completion is normal in any Oracle Database.
The presence of this wait event does not necessarily indicate a performance problem.
However, if the time spent waiting for single block reads is significant compared to other waits, you must investigate the reason for it.

This may be:

1. Frequent DML operations (update, delete) could fragment your indexes. You can identify them, following the steps described here and here. Then rebuild them.
2. Perhaps the index used is not the appropriate one for your query. Create an index that matches your query better, or, if it already exists, tune it, so it would be chosen.
3. Reduce the Disk I/O contention, by distributing the index to different filesystems.
4. Increase the db_cache_size parameter.

Use the script posted in "Identify waiting sessions".

From that, you can:

1. Using the SQL hash value from the CURRENT_EVENT cursor, you can capture the SQL text from the GV$SQLTEXT view as shown next and store it in the appropriate history table.
If you are also interested in the SQL statistics, you can get the information from the V$SQLAREA using the same SQL hash value from the cursor:
SELECT INST_ID,
         HASH_VALUE,
         ADDRESS,
         PIECE,
         SQL_TEXT
    FROM GV$SQLTEXT
   WHERE HASH_VALUE = 4190307765                              --sql_hash_value
                                AND INST_ID = 1                 --RAC Instance
ORDER BY INST_ID, PIECE;

2. Find the segment being read:
SELECT DISTINCT A.OBJECT_NAME, A.SUBOBJECT_NAME
  FROM DBA_OBJECTS A, SYS.X$BH B
 WHERE     (A.OBJECT_ID = B.OBJ OR A.DATA_OBJECT_ID = B.OBJ)
       AND B.FILE# = 604                          --P1
       AND B.DBABLK = 2003;                       --P2

db file scattered read


The db file scattered read event is posted by the session when it issues an I/O request to read multiple data blocks.
The blocks read from the datafiles are scattered into the buffer cache.
These blocks need not remain contiguous in the buffer cache.
The event typically occurs during full table scans or index fast full scans.
The initialization parameter, DB_FILE_MULTIBLOCK_READ_COUNT determines the maximum number of data blocks to read.

Waiting on datafile I/O completion is normal in any Oracle database.
The presence of this wait event does not necessarily indicate a performance problem.
However, if the time spent waiting for multiblock reads is significant compared to other waits, you must investigate the reason for it.

This may be:

1. Perhaps creation of new indexes could reduce the full table scans, occurring to our database.
2. Frequent DML operations (update, delete) could fragment your segments. You can identify them, following the steps described here and here. Then move your fragmented tables and rebuild your fragmented indexes.
3. Use Parallelsm, if full table scans/index fast full scans cannot be avoided.
4. Use tablespace with bigger block size.

Use the script posted in "Identify waiting sessions".

From that, you can:

1. Using the SQL hash value from the CURRENT_EVENT cursor, you can capture the SQL text from the GV$SQLTEXT view as shown next and store it in the appropriate history table. If you are also interested in the SQL statistics, you can get the information from the V$SQLAREA using the same SQL hash value from the cursor:

SELECT INST_ID,
         HASH_VALUE,
         ADDRESS,
         PIECE,
         SQL_TEXT
    FROM GV$SQLTEXT
   WHERE HASH_VALUE = 4190307765                              --sql_hash_value
                                AND INST_ID = 1                 --RAC Instance
ORDER BY INST_ID, PIECE;

2. Find the segment being read:
SELECT DISTINCT A.OBJECT_NAME, A.SUBOBJECT_NAME
  FROM DBA_OBJECTS A, SYS.X$BH B
 WHERE     (A.OBJECT_ID = B.OBJ OR A.DATA_OBJECT_ID = B.OBJ)
       AND B.FILE# = 604                                                  --P1
       AND B.DBABLK = 2003;                                               --P2

buffer busy waits

The buffer busy waits event occurs when a session wants to access a data block in the buffer cache that is currently in use by some other session.
The other session is either reading the same data block into the buffer cache from the datafile, or it is modifying the one in the buffer cache.
In order to guarantee that the reader session has a coherent image of the block with either all of the changes or none of the changes,
the session modifying the block marks the block header with a flag letting other sessions know that a change is taking place and to wait until the complete change is applied.

Use the script posted in "Identify waiting sessions".

From that, you can:

1. Using the SQL hash value from the CURRENT_EVENT cursor, you can capture the SQL text from the GV$SQLTEXT view as shown next and store it in the appropriate history table.
If you are also interested in the SQL statistics, you can get the information from the V$SQLAREA using the same SQL hash value from the cursor:
SELECT INST_ID,
         HASH_VALUE,
         ADDRESS,
         PIECE,
         SQL_TEXT
    FROM GV$SQLTEXT
   WHERE HASH_VALUE = 4190307765                              --sql_hash_value
                                AND INST_ID = 1                 --RAC Instance
ORDER BY INST_ID, PIECE;

2. Find the segment, which the responsible data block belongs to:
SELECT OWNER, SEGMENT_NAME, SEGMENT_TYPE
  FROM DBA_EXTENTS
 WHERE FILE_ID = &P1 AND &P2 BETWEEN BLOCK_ID AND BLOCK_ID + BLOCKS - 1;

3. Find the datafile, where the above segment is stored:
SELECT *
  FROM DBA_DATA_FILES
 WHERE FILE_ID = &P1;

4. For databases prior to 10gR1, P3 indicatew the reason for the wait. These are:
100: The blocking session is reading the block into cache, most likely the undo block for rollback; the waiting session wants exclusive access to create a new block for this information.
110: The blocked or waiting session wants to access the current image of the block in either shared (to read) or exclusive (to write) mode, but the blocking session is reading the block into cache.
120: The blocked session wants to access the block in current mode; the blocking session is reading the block in the cache. This happens during buffer lookups.
130: One or more sessions want to access the same block, but it is not in the buffer.
One session will perform the I/O operation and post either a "db file sequential read" or a "db file scattered read" event,while the waiting sessions will post buffer busy waits with this reason code.
200:The blocking session is modifying the block in the cache; the waiting session wants exclusive access to create a new block.
210:The blocking session is modifying the block, while the blocked session wants the current version of the block in exclusive mode. This happens when two processes want to update the same block.
220:The blocking session is modifying the block, while the blocked session wants to access the block in current mode during buffer lookup.
230: The blocking session is modifying the block, while the blocked session wants shared access of a coherent version of the block.
231:The blocking session is modifying the block, while the blocked session is the reading current version of the block when shared access of a coherent version of the block was wanted.

enqueue

Summary
Enqueues are sophisticated locking mechanisms for managing access to shared resources such as schema objects, background jobs, and redo threads.
Oracle uses enqueues for two purposes.
First, they prevent multiple concurrent sessions from sharing the same resource when their lock modes are incompatible.
Second, they allow sessions to share the same resource when their lock modes are compatible.
When a session requests a lock on the whole or part of an object, and if the requested lock mode is incompatible with the mode held by another session, the requesting session puts its lock request in a queue (hence enqueue) and waits to be served in order. This event is known as an enqueue wait.
Enqueue waits are waits for a variety of local locks, except for buffer locks, library cache locks, row cache locks, and PCM (Parallel Cache Management) locks.
If you see a wait event of type:enqueue then this is related with transaction locking, with other words there is a blocked session.

To find who is blocking it execute the query posted in "Blocking Sessions".
The tip is obvious! Killing the blocking session disappears the enqueue.

Another way is to use the script posted in "Identify waiting sessions".
From that, you can:

1. Using the SQL hash value from the CURRENT_EVENT cursor, you can capture the SQL text from the GV$SQLTEXT view as shown next and store it in the appropriate history table.
If you are also interested in the SQL statistics, you can get the information from the V$SQLAREA using the same SQL hash value from the cursor:
SELECT INST_ID,
         HASH_VALUE,
         ADDRESS,
         PIECE,
         SQL_TEXT
    FROM GV$SQLTEXT
   WHERE HASH_VALUE = 4190307765                              --sql_hash_value
                                AND INST_ID = 1                 --RAC Instance
ORDER BY INST_ID, PIECE;

2. Identify The blocking session:
SELECT A.INST_ID,
       A.SID,
       A.SERIAL#,
       A.USERNAME,
       A.MODULE,
       A.PADDR,
       A.LOGON_TIME,
       A.SQL_HASH_VALUE,
       B.TYPE,
       B.LMODE,
       B.CTIME,
       A.STATUS,
          'alter system kill session '
       || ''''
       || A.SID
       || ',
'
       || A.SERIAL#
       || ''''
       || ' immediate;'
          KILL_SESSION
  FROM GV$SESSION A, GV$LOCK B
 WHERE     A.INST_ID = B.INST_ID
       AND A.SID = B.SID
       AND B.ID1 = 131253                                                 --P2
       AND B.ID2 = 0                                                      --P3
       AND B.BLOCK > 0;

3. Find out the enqueue name and mode requested by the waiting process:
SELECT SID,
       CHR (BITAND (P1, -16777216) / 16777215)
       || CHR (BITAND (P1, 16711680) / 65535)
          "Name",
       (BITAND (P1, 65535)) "Mode"
  FROM V$SESSION_WAIT
 WHERE EVENT = 'enqueue';

Blocking Sessions

Summary
The script following finds the blocking sessions in the database:
SELECT                                                           /*+ RULE */
        LPAD ('--->', DECODE (A.REQUEST, 0, 0, 5)) || A.SID SID,
         B.SERIAL#,
         DECODE (TRUNC (SYSDATE - LOGON_TIME),
                 0, NULL,
                 TRUNC (SYSDATE - LOGON_TIME) || ' Days' || ' + ')
         || TO_CHAR (
               TO_DATE (TRUNC (MOD (SYSDATE - LOGON_TIME, 1) * 86400), 'SSSSS'),
               'HH24:MI:SS')
            LOGON,
         B.STATUS,
         B.SCHEMANAME SCHEMA,
         DECODE (O.OWNER || '.' || O.OBJECT_NAME,
                 '.', NULL,
                 O.OWNER || '.' || O.OBJECT_NAME)
            OBJECT,
         O.OBJECT_TYPE,
         B.OSUSER,
         B.MACHINE,
         B.MODULE,
         B.PROGRAM,
         DECODE (BLOCK, 0, NULL, 'BLOCKER')
         || DECODE (REQUEST, 0, NULL, '-->WAITER')
            BLOCKER,
         DECODE (A.LMODE,
                 0, 'None',
                 1, 'Null',
                 2, 'Row-S (SS)',
                 3, 'Row-X (SX)',
                 4, 'Share',
                 5, 'S/Row-X (SSX)',
                 6, 'Exclusive',
                 A.LMODE)
            LMODE,
         DECODE (
            TRUNC (CTIME / 86400),
            0, TO_CHAR (TO_DATE (CTIME, 'SSSSS'), 'HH24:MI:SS'),
            TRUNC (CTIME / 86400) || ' Days + '
            || TO_CHAR (
                  TO_DATE (CTIME - (TRUNC (CTIME / 86400)) * 86400, 'SSSSS'),
                  'HH24:MI:SS'))
            TIME,
         A.TYPE,
            'alter system kill session '
         || ''''
         || A.SID
         || ', '
         || B.SERIAL#
         || ''''
         || ' immediate;'
            KILL_SESSION,
         DECODE (
            OBJECT_TYPE,
            NULL, NULL,
               'Dbms_Rowid.rowid_create(1, '
            || ROW_WAIT_OBJ#
            || ', '
            || ROW_WAIT_FILE#
            || ',
'
            || ROW_WAIT_BLOCK#
            || ', '
            || ROW_WAIT_ROW#
            || ')')
            ROW_ID
    FROM V$LOCK A, V$SESSION B, DBA_OBJECTS O
   WHERE A.SID = B.SID AND (LMODE = 0 OR BLOCK = 1)
         AND O.OBJECT_ID(+) =
                DECODE (B.ROW_WAIT_OBJ#, -1, NULL, B.ROW_WAIT_OBJ#)
ORDER BY A.ID1, A.REQUEST;

For RAC databases the above script will not discover the blockings between sessions in different nodes.
Try this one:
  SELECT B.INST_ID,
         LPAD ('--->', DECODE (A.REQUEST, 0, 0, 5)) || A.SID SID,
         A.ID1,
         A.ID2,
         A.LMODE,
         A.BLOCK,
         A.REQUEST,
         DECODE (A.TYPE,
                 'MR', 'Media Recovery',
                 'RT', 'Redo Thread',
                 'UN', 'User Name',
                 'TX', 'Transaction',
                 'TM', 'DML',
                 'UL', 'PL/SQL User Lock',
                 'DX', 'Distributed Xaction',
                 'CF', 'Control File',
                 'IS', 'Instance State',
                 'FS', 'File Set',
                 'IR', 'Instance Recovery',
                 'ST', 'Disk Space Transaction',
                 'TS', 'Temp Segment',
                 'IV', 'Library Cache Invalidation',
                 'LS', 'Log Start or Switch',
                 'RW', 'Row Wait',
                 'SQ', 'Sequence Number',
                 'TE', 'Extend Table',
                 'TT', 'Temp Table',
                 A.TYPE)
            LOCK_TYPE,
         B.PROGRAM,
         B.OSUSER,
         B.USERNAME,
         B.STATUS,
         B.MODULE,
         B.ACTION,
         B.LOGON_TIME,
         B.LAST_CALL_ET,
            'alter system kill session '
         || ''''
         || A.SID
         || ', '
         || B.SERIAL#
         || ''''
         || ' immediate;'
            KILL_SESSION,
         DECODE (
            OBJECT_TYPE,
            NULL, NULL,
               'Dbms_Rowid.rowid_create(1, '
            || ROW_WAIT_OBJ#
            || ', '
            || ROW_WAIT_FILE#
            || ', '
            || ROW_WAIT_BLOCK#
            || ', '
            || ROW_WAIT_ROW#
            || ')')
            ROW_ID
    FROM GV$LOCK A, GV$SESSION B, DBA_OBJECTS O
   WHERE     (A.ID1, A.ID2) IN (SELECT ID1, ID2
                                  FROM GV$LOCK
                                 WHERE LMODE = 0)
         AND A.INST_ID = B.INST_ID
         AND A.SID = B.SID
         AND O.OBJECT_ID(+) =
                DECODE (B.ROW_WAIT_OBJ#, -1, NULL, B.ROW_WAIT_OBJ#)
ORDER BY A.ID1, A.ID2, A.REQUEST;

Tip: If the column BLOCK=2, 'Global' then this lock is global, it comes from the other instance.
Tip: The last column of the query for blocked sessions is ROWID of the record!
To find the exact locked row execute:
SELECT *
  FROM OBJECT
 WHERE ROWID = DBMS_ROWID.ROWID_CREATE (1,
                                        48804,
                                        31,
                                        114809,
                                        210);